


 Sign Out
Pharmacodynamics: Clinical Studies: Patients Without Prior Antiretroviral Therapy: Study 863: Lopinavir and Ritonavir Capsules twice daily + stavudine + lamivudine compared to nelfinavir three-times-daily + stavudine + lamivudine: Study 863 was a randomized, double-blind, multicenter trial comparing treatment with lopinavir and ritonavir capsules (400/100 mg twice daily) plus stavudine and lamivudine versus nelfinavir (750 mg three-times daily) plus stavudine and lamivudine in 653 antiretroviral treatment naïve patients. Patients had a mean age of 38 years (range: 19 to 84), 57% were Caucasian, and 80% were male. Mean baseline CD4+ cell count was 259 cells/mm3 (range: 2 to 949 cells/mm3) and mean baseline plasma HIV-1 RNA was 4.9 log10 copies/mL (range: 2.6 to 6.8 log10 copies/mL).
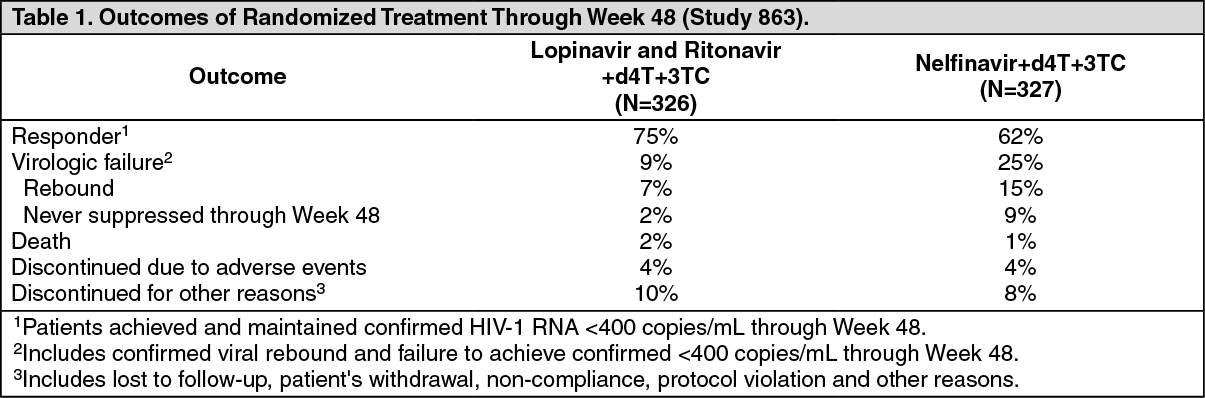
Treatment response and outcomes of randomized treatment are presented in Table 1. (See Table 1.)
 Click on icon to see table/diagram/image
Overall discontinuation through Week 48, including patients who discontinued subsequent to virologic failure, was 17% in the lopinavir and ritonavir arm and 24% in the nelfinavir arm.
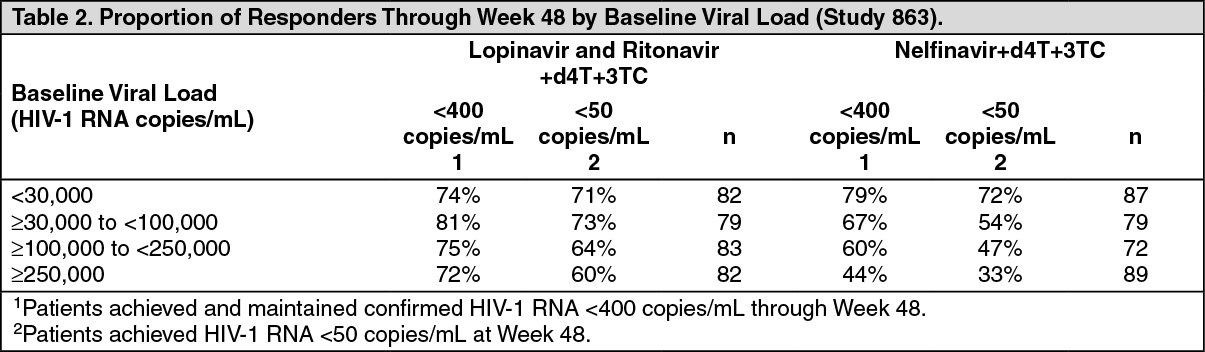
Through 48 weeks of therapy, there was a statistically significantly higher proportion of patients in the lopinavir and ritonavir arm compared to the nelfinavir arm with HIV-1 RNA < 400 copies/mL (75% vs. 62%, respectively) and HIV-1 RNA < 50 copies/mL (67% vs. 52%, respectively). Treatment response by baseline HIV-1 RNA level subgroups is presented in Table 2. (See Table 2.)
 Click on icon to see table/diagram/image
Through 48 weeks of therapy, the mean increase from baseline in CD4+ cell count was 207 cells/mm3 for the lopinavir and ritonavir arm and 195 cells/mm3 for the nelfinavir arm.
Study 730: Lopinavir and Ritonavir Tablets once daily + tenofovir DF + emtricitabine compared to Lopinavir and Ritonavir Tablets twice daily + tenofovir DF + emtricitabine: Study 730 was a randomized, open-label, multicenter trial comparing treatment with lopinavir and ritonavir 800/200 mg once daily plus tenofovir DF and emtricitabine versus lopinavir and ritonavir 400/100 mg twice daily plus tenofovir DF and emtricitabine in 664 antiretroviral treatment-naïve patients. Patients were randomized in a 1:1 ratio to receive either lopinavir and ritonavir 800/200 mg once daily (n = 333) or lopinavir and ritonavir 400/100 mg twice daily (n = 331). Further stratification within each group was 1:1 (tablet vs. capsule). Patients administered the capsule were switched to the tablet formulation at Week 8 and maintained on their randomized dosing schedule. Patients were administered emtricitabine 200 mg once daily and tenofovir DF 300 mg once daily. Mean age of patients enrolled was 39 years (range: 19 to 71); 75% were Caucasian, and 78% were male. Mean baseline CD4+ cell count was 216 cells/mm3 (range: 20 to 775 cells/mm3) and mean baseline plasma HIV-1 RNA was 5.0 log10 copies/mL (range: 1.7 to 7.0 log10 copies/mL).
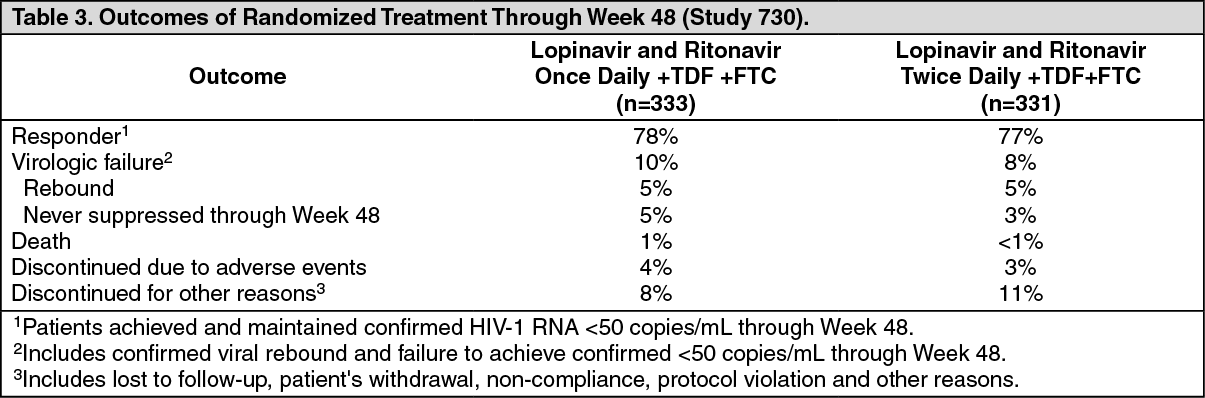
Treatment response and outcomes of randomized treatment through Week 48 are presented in Table 3. (See Table 3.)
 Click on icon to see table/diagram/image
Through 48 weeks of therapy, 78% in the lopinavir and ritonavir once daily arm and 77% in the lopinavir and ritonavir twice daily arm achieved and maintained HIV-1 RNA < 50 copies/mL (95% confidence interval for the difference, -5.9% to 6.8%). Mean CD4+ cell count increases at Week 48 were 186 cells/mm3 for the lopinavir and ritonavir once daily arm and 198 cells/mm3 for the lopinavir and ritonavir twice daily arm.
Patients With Prior Antiretroviral Therapy: Study 888: Lopinavir and Ritonavir Capsules twice daily + nevirapine + NRTIs compared to investigator-selected protease inhibitor(s) + nevirapine + NRTIs: Study 888 was a randomized, open-label, multicenter trial comparing treatment with lopinavir and ritonavir capsules (400/100 mg twice daily) plus nevirapine and nucleoside reverse transcriptase inhibitors versus investigator-selected protease inhibitor(s) plus nevirapine and nucleoside reverse transcriptase inhibitors in 288 single protease inhibitor-experienced, non-nucleoside reverse transcriptase inhibitor (NNRTI)-naïve patients. Patients had a mean age of 40 years (range: 18 to 74), 68% were Caucasian, and 86% were male. Mean baseline CD4+cell count was 322 cells/mm3 (range: 10 to 1059 cells/mm3) and mean baseline plasma HIV-1 RNA was 4.1 log10 copies/mL (range: 2.6 to 6.0 log10 copies/mL).
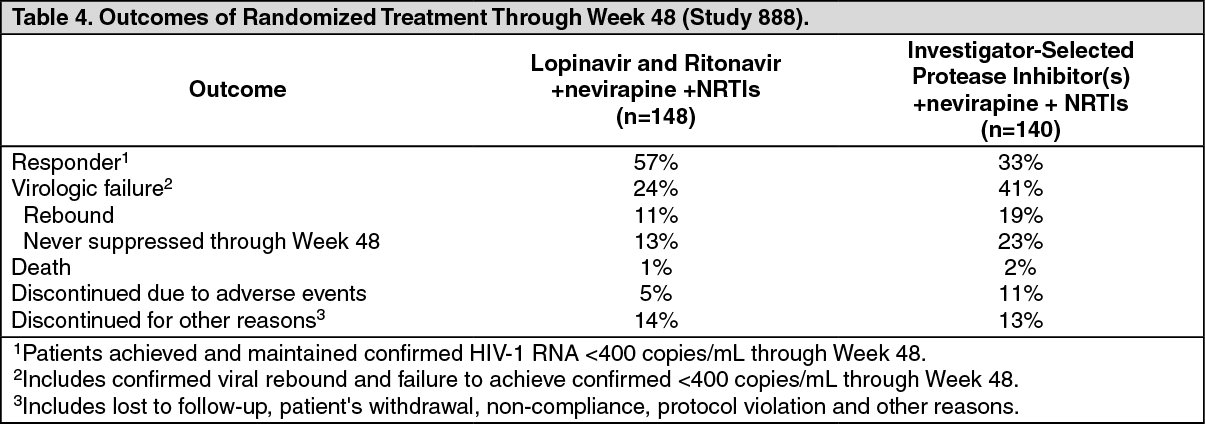
Treatment response and outcomes of randomized treatment through Week 48 are presented in Table 4. (See Table 4.)
 Click on icon to see table/diagram/image
Through 48 weeks of therapy, there was a statistically significantly higher proportion of patients in the lopinavir and ritonavir arm compared to the investigator-selected protease inhibitor(s) arm with HIV-1 RNA < 400 copies/mL (57% vs. 33%, respectively).
Through 48 weeks of therapy, the mean increase from baseline in CD4+ cell count was 111 cells/mm3 for the lopinavir and ritonavir arm and 112 cells/mm3 for the investigator-selected protease inhibitor(s) arm.
Other Studies Supporting Approval: Study 720: Lopinavir and Ritonavir twice daily + stavudine + lamivudine.
Study 765: Lopinavir and Ritonavir twice daily + nevirapine + NRTIs.
Study 720 (patients without prior antiretroviral therapy) and study 765 (patients with prior protease inhibitor therapy) were randomized, blinded, multi-center trials evaluating treatment with lopinavir and ritonavir at up to three dose levels (200/100 mg twice daily [720 only], 400/100 mg twice daily, and 400/200 mg twice daily). In Study 720, all patients switched to 400/100 mg twice daily between Weeks 48 to 72. Patients in study 720 had a mean age of 35 years, 70% were Caucasian, and 96% were male, while patients in study 765 had a mean age of 40 years, 73% were Caucasian, and 90% were male. Mean (range) baseline CD4+ cell counts for patients in study 720 and study 765 were 338 (3 to 918) and 372 (72 to 807) cells/mm3, respectively. Mean (range) baseline plasma HIV-1 RNA levels for patients in study 720 and study 765 were 4.9 (3.3 to 6.3) and 4.0 (2.9 to 5.8) log10 copies/mL, respectively.
Through 360 weeks of treatment in study 720, the proportion of patients with HIV-1 RNA < 400 (< 50) copies/mL was 61% (59%) [n = 100]. Among patients completing 360 weeks of treatment with CD4+ cell count measurements [n=60], the mean (median) increase in CD4+ cell count was 501 (457) cells/mm3. Thirty-nine patients (39%) discontinued the study, including 13 (13%) discontinuations due to adverse reactions and 1 (1%) death.
Through 144 weeks of treatment in study 765, the proportion of patients with HIV-1 RNA < 400 (< 50) copies/mL was 54% (50%) [n = 70], and the corresponding mean increase in CD4+ cell count was 212 cells/mm3. Twenty-seven patients (39%) discontinued the study, including 5 (7%) discontinuations secondary to adverse reactions and 2 (3%) deaths.
Pediatric Studies: Study 1030 was an open-label, multicenter, dose-finding trial evaluating the pharmacokinetic profile, tolerability, safety and efficacy of lopinavir and ritonavir oral solution containing lopinavir 80 mg/mL and ritonavir 20 mg/mL at a dose of 300/75 mg/m2 twice daily plus 2 NRTIs in HIV-1 infected infants ≥14 days and <6 months of age.
Ten infants, ≥14 days and <6 wks of age, were enrolled at a median (range) age of 5.7 (3.6 to 6.0) weeks and all completed 24 weeks. At entry, median (range) HIV-1 RNA was 6.0 (4.7 to 7.2) log10 copies/mL. Seven of 10 infants had HIV-1 RNA <400 copies/mL at Week 24. At entry, median (range) CD4+ percentage was 41 (16 to 59) with a median decrease of 1% (95% CI: -10, 18) from baseline to week 24 in 6 infants with available data.
Twenty-one infants, between 6 weeks and 6 months of age, were enrolled at a median (range) age of 14.7 (6.9 to 25.7) weeks and 19 of 21 infants completed 24 weeks. At entry, median (range) HIV RNA level was 5.8 (3.7 to 6.9) log10 copies/mL. Ten of 21 infants had HIV RNA <400 copies/mL at Week 24. At entry, the median (range) CD4+ percentage was 32 (11 to 54) with a median increase of 4% (95% CI: - 1, 9) from baseline to week 24 in 19 infants with available data.
See Pharmacokinetics as follows for pharmacokinetic results.
Study 940 was an open-label, multicenter trial evaluating the pharmacokinetic profile, tolerability, safety and efficacy of lopinavir and ritonavir oral solution containing lopinavir 80 mg/mL and ritonavir 20 mg/mL in 100 antiretroviral naïve (44%) and experienced (56%) pediatric patients. All patients were non-nucleoside reverse transcriptase inhibitor naïve. Patients were randomized to either 230 mg lopinavir/57.5 mg ritonavir per m2 or 300 mg lopinavir/75 mg ritonavir per m2. Naïve patients also received lamivudine and stavudine. Experienced patients received nevirapine plus up to two nucleoside reverse transcriptase inhibitors.
Safety, efficacy and pharmacokinetic profiles of the two dose regimens were assessed after three weeks of therapy in each patient. After analysis of these data, all patients were continued on the 300 mg lopinavir/75 mg ritonavir per m2 dose. Patients had a mean age of 5 years (range 6 months to 12 years) with 14% less than 2 years. Mean baseline CD4+ cell count was 838 cells/mm3 and mean baseline plasma HIV-1 RNA was 4.7 log10 copies/mL.
Through 48 weeks of therapy, the proportion of patients who achieved and sustained an HIV-1 RNA < 400 copies/mL was 80% for antiretroviral naïve patients and 71% for antiretroviral experienced patients. The mean increase from baseline in CD4+ cell count was 404 cells/mm3 for antiretroviral naïve and 284 cells/mm3 for antiretroviral experienced patients treated through 48 weeks. At 48 weeks, two patients (2%) had prematurely discontinued the study. One antiretroviral naïve patient prematurely discontinued secondary to an adverse reaction, while one antiretroviral experienced patient prematurely discontinued secondary to an HIV-1 related event.
Dose selection in pediatric patients was based on the following: Among patients 14 days to 6 months of age receiving 300/75 mg/m2 twice daily without nevirapine, plasma concentrations were lower than those observed in adults or in older children. This dose resulted in HIV-1 RNA < 400 copies/mL in 55% of patients (70% in those initiating treatment at <6 weeks of age).
Among patients 6 months to 12 years of age, the 230/57.5 mg/m2 oral solution twice daily regimen without nevirapine and the 300/75 mg/m2 oral solution twice daily regimen with nevirapine provided lopinavir plasma concentrations similar to those obtained in adult patients receiving the 400/100 mg twice daily regimen (without nevirapine). These doses resulted in treatment benefit (proportion of patients with HIV-1 RNA < 400 copies/mL) similar to that seen in the adult clinical trials.
Among patients 12 to 18 years of age receiving 400/100 mg/m2 or 480/120 mg/m2 (with efavirenz) twice daily, plasma concentrations were 60 to 100% higher than among 6 to 12 year old patients receiving 230/57.5 mg/m2. Mean apparent clearance was similar to that observed in adult patients receiving standard dose and in patients 6 to 12 years of age. Although changes in HIV-1 RNA in patients with prior treatment failure were less than anticipated, the pharmacokinetic data supports use of similar dosing as in patients 6 to 12 years of age, not to exceed the recommended adult dose.
For all age groups, the body surface area dosing was converted to body weight dosing using the actual patient dose.
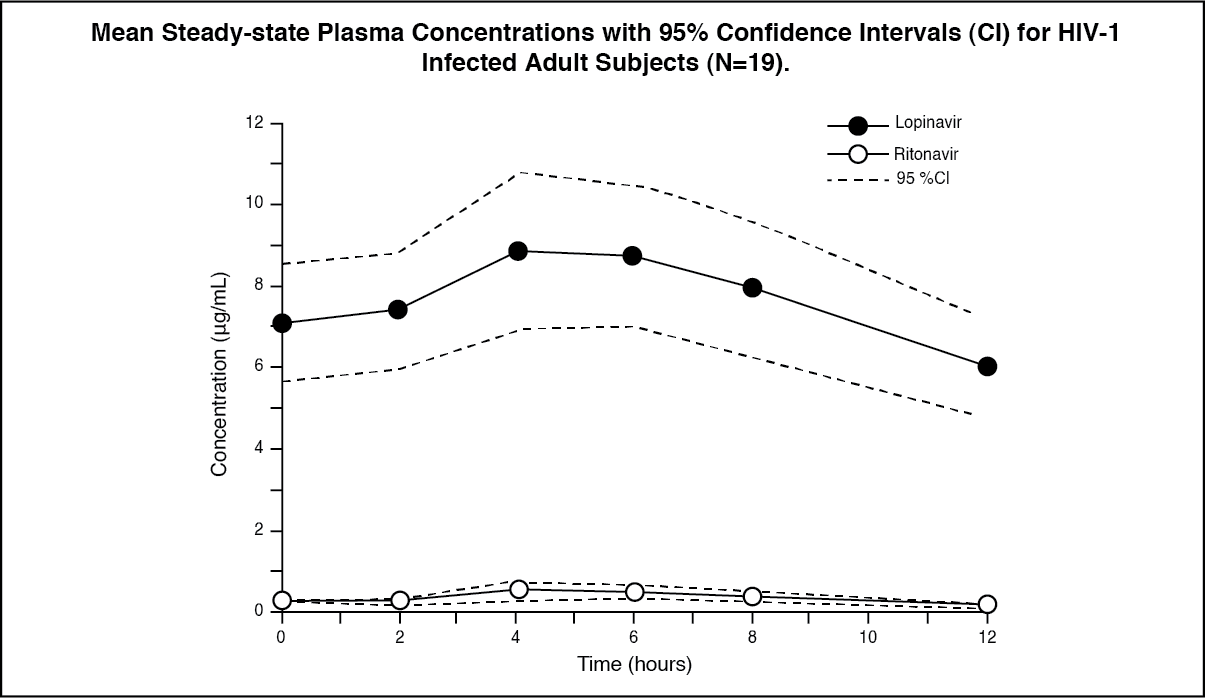
Pharmacokinetics: The pharmacokinetic properties of lopinavir co-administered with ritonavir have been evaluated in healthy adult volunteers and in HIV-1 infected patients; no substantial differences were observed between the two groups. Lopinavir is essentially completely metabolized by CYP3A. Ritonavir inhibits the metabolism of lopinavir, thereby increasing the plasma levels of lopinavir. Across studies, administration of lopinavir and ritonavir 400/100 mg twice daily yields mean steady-state lopinavir plasma concentrations 15- to 20-fold higher than those of ritonavir in HIV-1 infected patients. The plasma levels of ritonavir are less than 7% of those obtained after the ritonavir dose of 600 mg twice daily. The in vitro antiviral EC50 of lopinavir is approximately 10-fold lower than that of ritonavir. Therefore, the antiviral activity of lopinavir and ritonavir is due to lopinavir.
Figure displays the mean steady-state plasma concentrations of lopinavir and ritonavir after lopinavir and ritonavir 400/100 mg twice daily with food for 3 weeks from a pharmacokinetic study in HIV-1 infected adult subjects (n = 19). (See figure.)
 Click on icon to see table/diagram/image
Absorption: In a pharmacokinetic study in HIV-1 positive subjects (n = 19), multiple dosing with 400/100 mg lopinavir and ritonavir twice daily with food for 3 weeks produced a mean ± SD lopinavir peak plasma concentration (Cmax) of 9.8 ± 3.7 mcg/mL, occurring approximately 4 hours after administration. The mean steady-state trough concentration prior to the morning dose was 7.1 ± 2.9 mcg/mL and minimum concentration within a dosing interval was 5.5 ± 2.7 mcg/mL. Lopinavir AUC over a 12 hour dosing interval averaged 92.6 ± 36.7 mcg•h/mL. The absolute bioavailability of lopinavir co-formulated with ritonavir in humans has not been established. Under nonfasting conditions (500 kcal, 25% from fat), lopinavir concentrations were similar following administration of lopinavir and ritonavir co-formulated capsules and oral solution. When administered under fasting conditions, both the mean AUC and Cmax of lopinavir were 22% lower for the lopinavir and ritonavir oral solution relative to the capsule formulation.
Plasma concentrations of lopinavir and ritonavir after administration of two 200/50 mg lopinavir and ritonavir tablets are similar to three 133.3/33.3 mg lopinavir and ritonavir capsules under fed conditions with less pharmacokinetic variability.
Effects of Food on Oral Absorption: Lopinavir and Ritonavir Tablets: No clinically significant changes in Cmax and AUC were observed following administration of lopinavir and ritonavir tablets under fed conditions compared to fasted conditions. Relative to fasting, administration of lopinavir and ritonavir tablets with a moderate fat meal (500 to 682 Kcal, 23 to 25% calories from fat) increased lopinavir AUC and Cmax by 26.9% and 17.6%, respectively. Relative to fasting, administration of lopinavir and ritonavir tablets with a high fat meal (872 Kcal, 56% from fat) increased lopinavir AUC by 18.9% but not Cmax. Therefore, lopinavir and ritonavir tablets may be taken with or without food.
Distribution: At steady state, lopinavir is approximately 98 to 99% bound to plasma proteins. Lopinavir binds to both alpha-1-acid glycoprotein (AAG) and albumin; however, it has a higher affinity for AAG. At steady state, lopinavir protein binding remains constant over the range of observed concentrations after 400/100 mg lopinavir and ritonavir twice daily, and is similar between healthy volunteers and HIV-1 positive patients.
Metabolism: In vitro experiments with human hepatic microsomes indicate that lopinavir primarily undergoes oxidative metabolism. Lopinavir is extensively metabolized by the hepatic cytochrome P450 system, almost exclusively by the CYP3A isozyme. Ritonavir is a potent CYP3A inhibitor which inhibits the metabolism of lopinavir, and therefore increases plasma levels of lopinavir. A 14C-lopinavir study in humans showed that 89% of the plasma radioactivity after a single 400/100 mg lopinavir and ritonavir dose was due to parent drug. At least 13 lopinavir oxidative metabolites have been identified in man. Ritonavir has been shown to induce metabolic enzymes, resulting in the induction of its own metabolism. Pre-dose lopinavir concentrations decline with time during multiple dosing, stabilizing after approximately 10 to 16 days.
Elimination: Following a 400/100 mg 14C-lopinavir/ritonavir dose, approximately 10.4 ± 2.3% and 82.6 ± 2.5% of an administered dose of 14C-lopinavir can be accounted for in urine and feces, respectively, after 8 days. Unchanged lopinavir accounted for approximately 2.2 and 19.8% of the administered dose in urine and feces, respectively. After multiple dosing, less than 3% of the lopinavir dose is excreted unchanged in the urine. The apparent oral clearance (CL/F) of lopinavir is 5.98 ± 5.75 L/hr (mean ± SD, n = 19).
Once Daily Dosing: The pharmacokinetics of once daily lopinavir and ritonavir have been evaluated in HIV-1 infected subjects naïve to antiretroviral treatment. Lopinavir and Ritonavir 800/200 mg was administered in combination with emtricitabine 200 mg and tenofovir DF 300 mg as part of a once daily regimen. Multiple dosing of 800/200 mg lopinavir and ritonavir once daily for 4 weeks with food (n = 24) produced a mean ± SD lopinavir peak plasma concentration (Cmax) of 11.8 ± 3.7 mcg/mL, occurring approximately 6 hours after administration. The mean steady-state lopinavir trough concentration prior to the morning dose was 3.2 ± 2.1 mcg/mL and minimum concentration within a dosing interval was 1.7 ± 1.6 mcg/mL. Lopinavir AUC over a 24 hour dosing interval averaged 154.1 ± 61.4 mcg·h/mL.
Effects on Electrocardiogram: QTcF interval was evaluated in a randomized, placebo and active (moxifloxacin 400 mg once daily) controlled crossover study in 39 healthy adults, with 10 measurements over 12 hours on Day 3. The maximum mean time-matched (95% upper confidence bound) differences in QTcF interval from placebo after baseline-correction were 5.3 (8.1) and 15.2 (18.0) mseconds (msec) for 400/100 mg twice daily and supratherapeutic 800/200 mg twice daily lopinavir and ritonavir, respectively. Lopinavir and Ritonavir 800/200 mg twice daily resulted in a Day 3 mean Cmax approximately 2-fold higher than the mean Cmax observed with the approved once daily and twice daily lopinavir and ritonavir doses at steady state.
PR interval prolongation was also noted in subjects receiving lopinavir and ritonavir in the same study on Day 3. The maximum mean (95% upper confidence bound) difference from placebo in the PR interval after baseline-correction were 24.9 (21.5, 28.3) and 31.9 (28.5, 35.3) msec for 400/100 mg twice daily and supratherapeutic 800/200 mg twice daily lopinavir and ritonavir, respectively. (See PR and QT Interval Prolongation under Precautions).
Special Populations: Gender, Race and Age: No gender related pharmacokinetic differences have been observed in adult patients. No clinically important pharmacokinetic differences due to race have been identified. Lopinavir pharmacokinetics have not been studied in elderly patients.
Pediatric Patients: The pharmacokinetics of lopinavir and ritonavir oral solution 300/75 mg/m2 twice daily and 230/57.5 mg/m2 twice daily have been studied in a total of 53 pediatric patients in Study 940, ranging in age from 6 months to 12 years [see Clinical Studies: Pediatric Studies as previously mentioned]. The 230/57.5 mg/m2 twice daily regimen without nevirapine and the 300/75 mg/m2 twice daily regimen with nevirapine provided lopinavir plasma concentrations similar to those obtained in adult patients receiving the 400/100 mg twice daily regimen (without nevirapine).
The mean steady-state lopinavir AUC, Cmax, and Cmin were 72.6 ± 31.1 mcg•h/mL, 8.2 ± 2.9 and 3.4 ± 2.1 mcg/mL, respectively after lopinavir and ritonavir oral solution 230/57.5 mg/m2 twice daily without nevirapine (n = 12), and were 85.8 ± 36.9 mcg•h/mL, 10.0 ± 3.3 and 3.6 ± 3.5 mcg/mL, respectively, after 300/75 mg/m2 twice daily with nevirapine (n = 12). The nevirapine regimen was 7 mg/kg twice daily (6 months to 8 years) or 4 mg/kg twice daily (> 8 years).
The pharmacokinetics of lopinavir and ritonavir oral solution at approximately 300/75 mg/m2 twice daily have also been evaluated in infants at approximately 6 weeks of age (n = 9) and between 6 weeks and 6 months of age (n = 18) in Study 1030. The mean steady-state lopinavir AUC12, Cmax, and C12 were 43.4 ± 14.8 mcg•h/mL, 5.2 ± 1.8 mcg/mL and 1.9 ± 1.1 mcg/mL, respectively, in infants at approximately 6 weeks of age, and 74.5 ± 37.9 mcg•h/mL, 9.4 ± 4.9 and 3.1 ± 1.8 mcg/mL, respectively, in infants between 6 weeks and 6 months of age after lopinavir and ritonavir oral solution was administered at approximately 300/75 mg/m2 twice daily without concomitant NNRTI therapy.
The pharmacokinetics of lopinavir and ritonavir soft gelatin capsule and oral solution (Group 1: 400/100 mg/m2 twice daily + 2 NRTIs; Group 2: 480/120 mg/m2 twice daily + ≥ 1 NRTI + 1 NNRTI) have been evaluated in children and adolescents age ≥2 years to < 18 years of age who had failed prior therapy (n=26) in Study 1038. Lopinavir and Ritonavir doses of 400/100 and 480/120 mg/m2 resulted in high lopinavir exposure, as almost all subjects had lopinavir AUC12 above 100 mcg•h/mL. Both groups of subjects also achieved relatively high average minimum lopinavir concentrations.
Lopinavir and Ritonavir once daily has not been evaluated in pediatric patients.
Renal Impairment: Lopinavir pharmacokinetics have not been studied in patients with renal impairment; however, since the renal clearance of lopinavir is negligible, a decrease in total body clearance is not expected in patients with renal impairment.
Hepatic Impairment: Lopinavir is principally metabolized and eliminated by the liver. Multiple dosing of lopinavir and ritonavir 400/100 mg twice daily to HIV-1 and HCV co-infected patients with mild to moderate hepatic impairment (n = 12) resulted in a 30% increase in lopinavir AUC and 20% increase in Cmax compared to HIV-1 infected subjects with normal hepatic function (n = 12). Additionally, the plasma protein binding of lopinavir was statistically significantly lower in both mild and moderate hepatic impairment compared to controls (99.09 vs. 99.31%, respectively). Caution should be exercised when administering lopinavir and ritonavir to subjects with hepatic impairment. Lopinavir and Ritonavir has not been studied in patients with severe hepatic impairment (see Hepatotoxicity and Hepatic Impairment under Precautions).
Drug Interactions: Lopinavir and Ritonavir is an inhibitor of the P450 isoform CYP3A in vitro. Co-administration of lopinavir and ritonavir and drugs primarily metabolized by CYP3A may result in increased plasma concentrations of the other drug, which could increase or prolong its therapeutic and adverse effects (see Contraindications and Interactions).
Lopinavir and Ritonavir does not inhibit CYP2D6, CYP2C9, CYP2C19, CYP2E1, CYP2B6 or CYP1A2 at clinically relevant concentrations.
Lopinavir and Ritonavir has been shown in vivo to induce its own metabolism and to increase the biotransformation of some drugs metabolized by cytochrome P450 enzymes and by glucuronidation.
Lopinavir and Ritonavir is metabolized by CYP3A. Drugs that induce CYP3A activity would be expected to increase the clearance of lopinavir, resulting in lowered plasma concentrations of lopinavir. Although not noted with concurrent ketoconazole, co-administration of lopinavir and ritonavir and other drugs that inhibit CYP3A may increase lopinavir plasma concentrations.
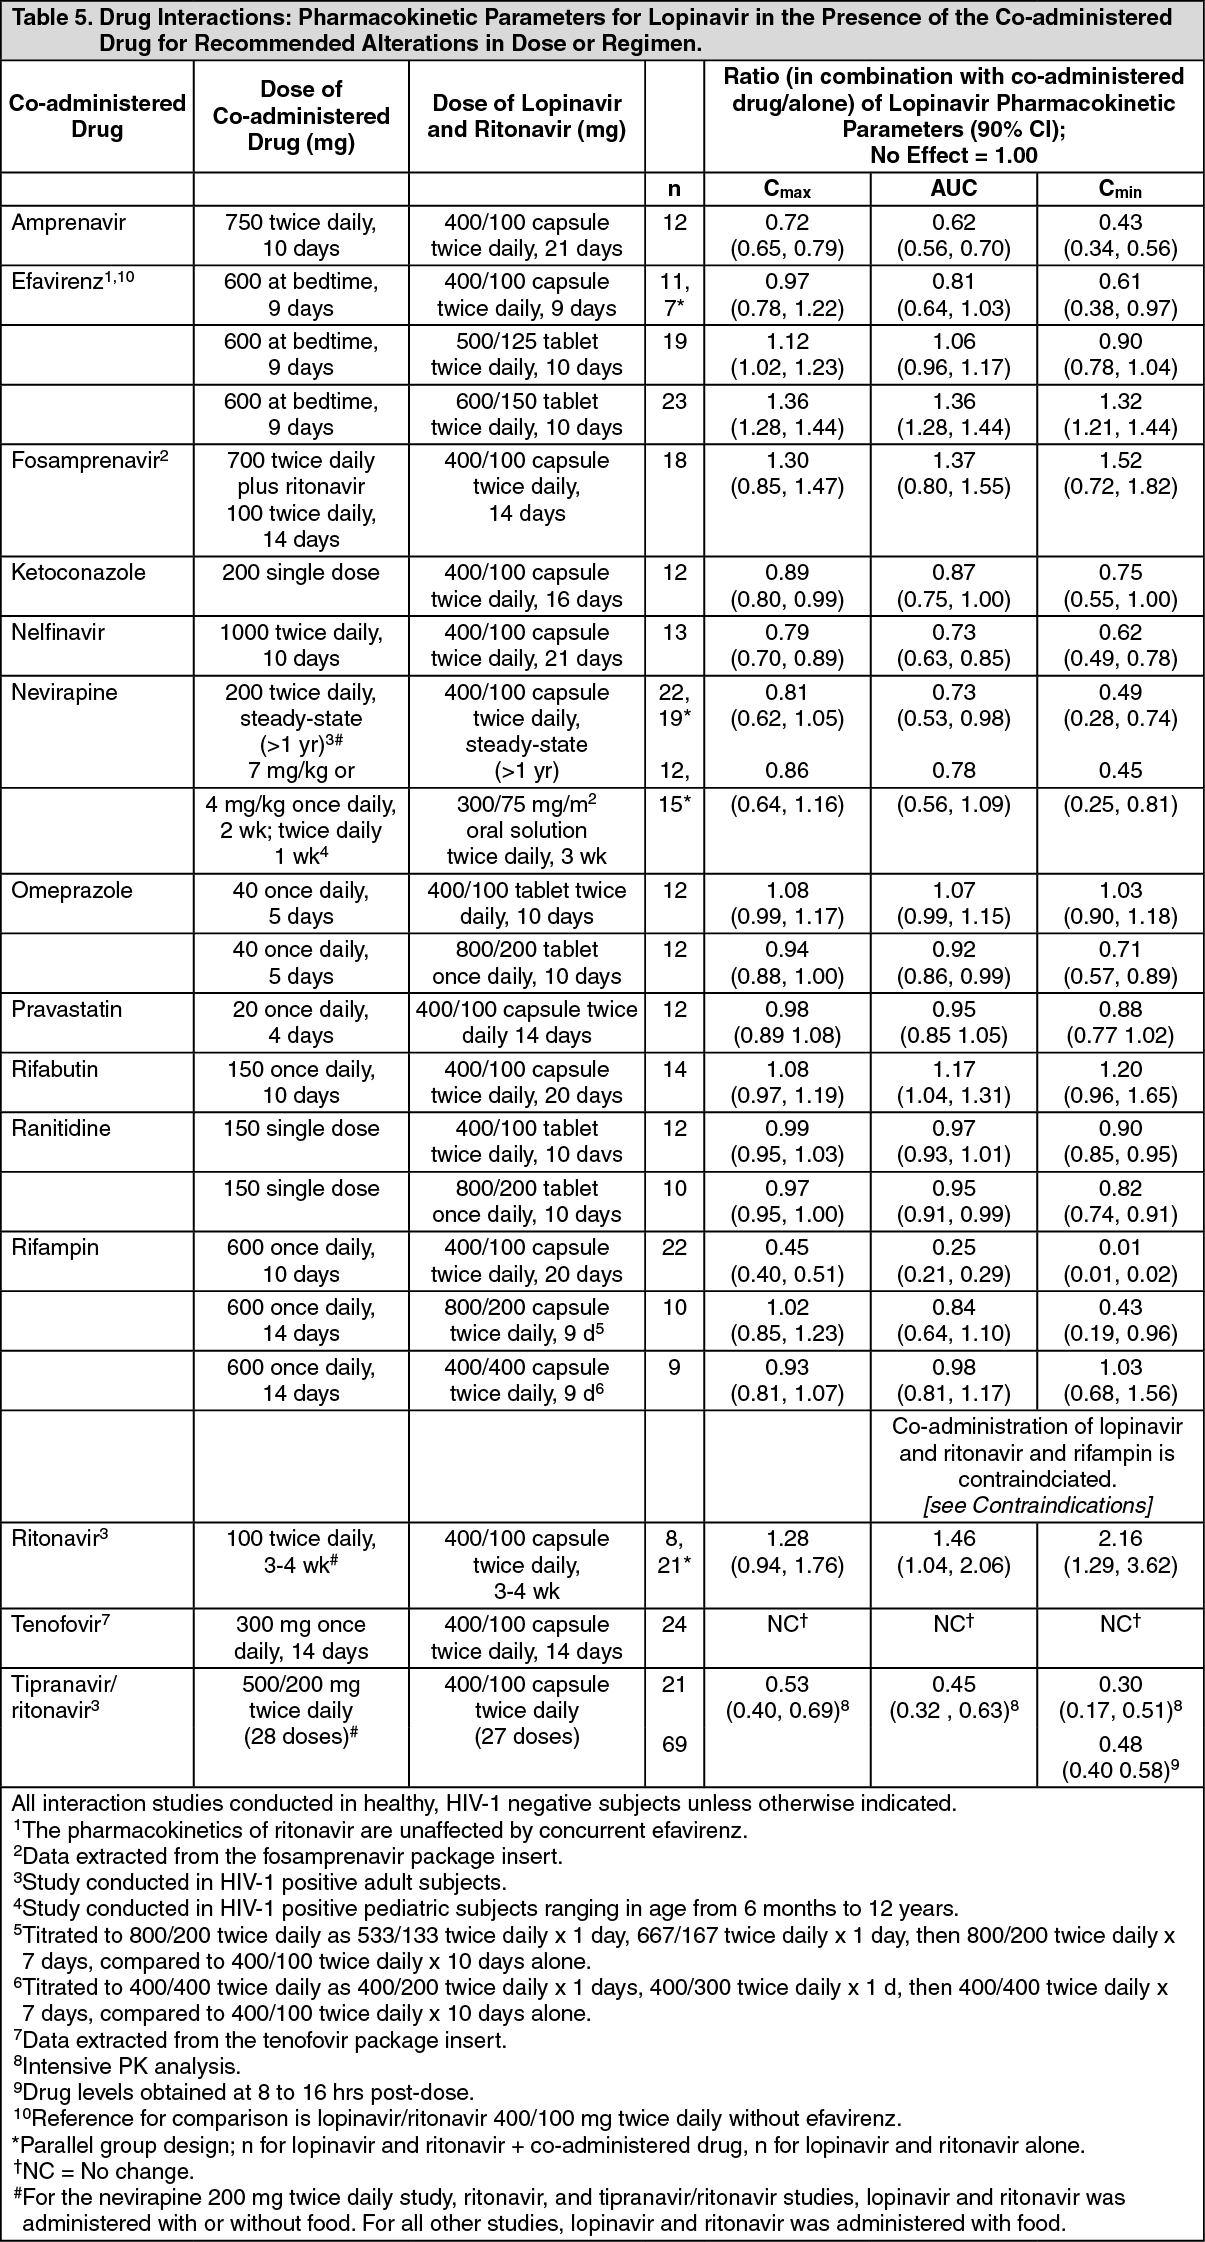
Drug interaction studies were performed with lopinavir and ritonavir and other drugs likely to be co-administered and some drugs commonly used as probes for pharmacokinetic interactions. The effects of co-administration of lopinavir and ritonavir on the AUC, Cmax and Cmin are summarized in Table 5 (effect of other drugs on lopinavir) and Table 6 (effect of lopinavir and ritonavir on other drugs). The effects of other drugs on ritonavir are not shown since they generally correlate with those observed with lopinavir (if lopinavir concentrations are decreased, ritonavir concentrations are decreased) unless otherwise indicated in the table footnotes. For information regarding clinical recommendations, see Table 17 in Interactions. (See Table 5 and Table 6.)
 Click on icon to see table/diagram/image
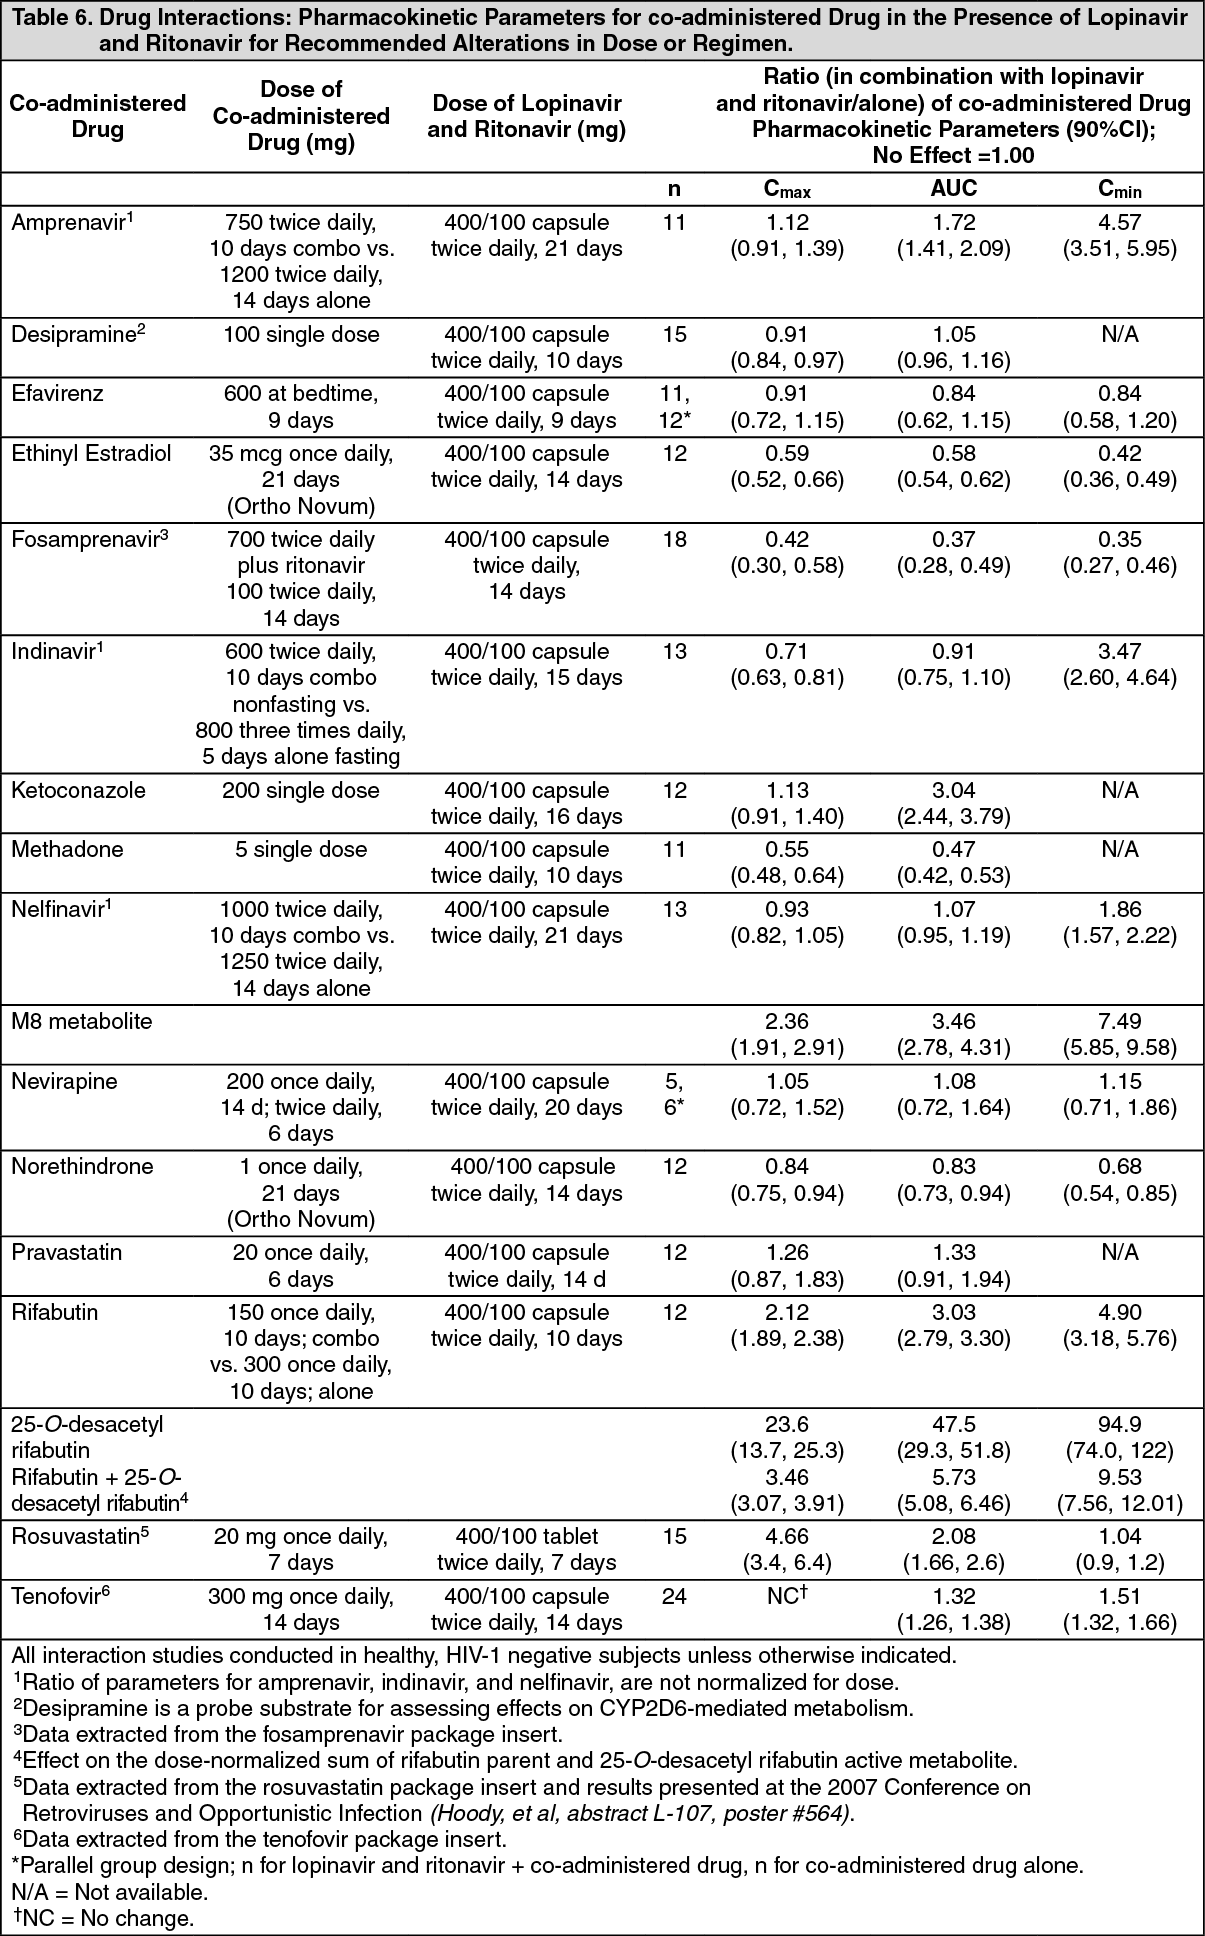 Click on icon to see table/diagram/image
Toxicology: Nonclinical Toxicology: Carcinogenesis, Mutagenesis, Impairment of Fertility: Lopinavir/ritonavir combination was evaluated for carcinogenic potential by oral gavage administration to mice and rats for up to 104 weeks. Results showed an increase in the incidence of benign hepatocellular adenomas and an increase in the combined incidence of hepatocellular adenomas plus carcinoma in both males and females in mice and males in rats at doses that produced approximately 1.6 to 2.2 times (mice) and 0.5 times (rats) the human exposure (based on AUC0-24hr measurement) at the recommended dose of 400/100 mg lopinavir and ritonavir twice daily. Administration of lopinavir/ritonavir did not cause a statistically significant increase in the incidence of any other benign or malignant neoplasm in mice or rats.
Carcinogenicity studies in mice and rats have been carried out on ritonavir. In male mice, there was a dose dependent increase in the incidence of both adenomas and combined adenomas and carcinomas in the liver. Based on AUC measurements, the exposure at the high dose was approximately 4-fold for males that of the exposure in humans with the recommended therapeutic dose (400/100 mg lopinavir and ritonavir twice daily). There were no carcinogenic effects seen in females at the dosages tested. The exposure at the high dose was approximately 9-fold for the females that of the exposure in humans. There were no carcinogenic effects in rats. In this study, the exposure at the high dose was approximately 0.7-fold that of the exposure in humans with the 400/100 mg lopinavir and ritonavir twice daily regimen. Based on the exposures achieved in the animal studies, the significance of the observed effects is not known. However, neither lopinavir nor ritonavir was found to be mutagenic or clastogenic in a battery of in vitro and in vivo assays including the Ames bacterial reverse mutation assay using S. typhimurium and E. coli, the mouse lymphoma assay, the mouse micronucleus test and chromosomal aberration assays in human lymphocytes.
Lopinavir in combination with ritonavir at a 2:1 ratio produced no effects on fertility in male and female rats at levels of 10/5, 30/15 or 100/50 mg/kg/day. Based on AUC measurements, the exposures in rats at the high doses were approximately 0.7-fold for lopinavir and 1.8-fold for ritonavir of the exposures in humans at the recommended therapeutic dose (400/100 mg twice daily).
Microbiology: Mechanism of Action: Lopinavir, an inhibitor of the HIV-1 protease, prevents cleavage of the Gag-Pol polyprotein, resulting in the production of immature, non-infectious viral particles.
Antiviral Activity: The antiviral activity of lopinavir against laboratory HIV strains and clinical HIV-1 isolates was evaluated in acutely infected lymphoblastic cell lines and peripheral blood lymphocytes, respectively. In the absence of human serum, the mean 50% effective concentration (EC50) values of lopinavir against five different HIV-1 subtype B laboratory strains ranged from 10 to 27 nM (0.006 to 0.017 mcg/mL, 1 mcg/mL = 1.6 µM) and ranged from 4 to 11 nM (0.003 to 0.007 mcg/mL) against several HIV-1 subtype B clinical isolates (n = 6). In the presence of 50% human serum, the mean EC50 values of lopinavir against these five HIV-1 laboratory strains ranged from 65 to 289 nM (0.04 to 0.18 mcg/mL), representing a 7- to 11-fold attenuation. Combination antiviral drug activity studies with lopinavir in cell cultures demonstrated additive to antagonistic activity with nelfinavir and additive to synergistic activity with amprenavir, atazanavir, indinavir, saquinavir and tipranavir. The EC50 values of lopinavir against three different HIV-2 strains ranged from 12 to 180 nM (0.008 to 113 mcg/mL).
Resistance: HIV-1 isolates with reduced susceptibility to lopinavir have been selected in cell culture. The presence of ritonavir does not appear to influence the selection of lopinavir-resistant viruses in cell culture.
The selection of resistance to lopinavir and ritonavir in antiretroviral treatment naïve patients has not yet been characterized. In a study of 653 antiretroviral treatment naïve patients (Study 863), plasma viral isolates from each patient on treatment with plasma HIV-1 RNA > 400 copies/mL at Week 24, 32, 40 and/or 48 were analyzed. No evidence of resistance to lopinavir and ritonavir was observed in 37 evaluable lopinavir and ritonavir-treated patients (0%). Evidence of genotypic resistance to nelfinavir, defined as the presence of the D30N and/or L90M substitution in HIV-1 protease, was observed in 25/76 (33%) of evaluable nelfinavir-treated patients. The selection of resistance to lopinavir and ritonavir in antiretroviral treatment naïve pediatric patients (Study 940) appears to be consistent with that seen in adult patients (Study 863).
Resistance to lopinavir and ritonavir has been noted to emerge in patients treated with other protease inhibitors prior to lopinavir and ritonavir therapy. In studies of 227 antiretroviral treatment naïve and protease inhibitor experienced patients, isolates from 4 of 23 patients with quantifiable (> 400 copies/mL) viral RNA following treatment with lopinavir and ritonavir for 12 to 100 weeks displayed significantly reduced susceptibility to lopinavir compared to the corresponding baseline viral isolates. Three of these patients had previously received treatment with a single protease inhibitor (indinavir, nelfinavir, or saquinavir) and one patient had received treatment with multiple protease inhibitors (indinavir, ritonavir, and saquinavir). All four of these patients had at least 4 substitutions associated with protease inhibitor resistance immediately prior to lopinavir and ritonavir therapy. Following viral rebound, isolates from these patients all contained additional substitutions, some of which are recognized to be associated with protease inhibitor resistance. However, there are insufficient data at this time to identify patterns of lopinavir-associated substitutions in isolates from patients on lopinavir and ritonavir therapy. The assessment of these patterns is under study.
Cross-resistance - Preclinical Studies: Varying degrees of cross-resistance have been observed among HIV-1 protease inhibitors. Little information is available on the cross-resistance of viruses that developed decreased susceptibility to lopinavir during lopinavir and ritonavir therapy.
The antiviral activity in cell culture of lopinavir against clinical isolates from patients previously treated with a single protease inhibitor was determined. Isolates that displayed > 4-fold reduced susceptibility to nelfinavir (n = 13) and saquinavir (n = 4), displayed < 4-fold reduced susceptibility to lopinavir. Isolates with > 4-fold reduced susceptibility to indinavir (n = 16) and ritonavir (n = 3) displayed a mean of 5.7- and 8.3-fold reduced susceptibility to lopinavir, respectively. Isolates from patients previously treated with two or more protease inhibitors showed greater reductions in susceptibility to lopinavir, as described in the following paragraph.
Clinical Studies - Antiviral Activity of lopinavir and ritonavir in Patients with Previous Protease Inhibitor Therapies: The clinical relevance of reduced susceptibility in cell culture to lopinavir has been examined by assessing the virologic response to lopinavir and ritonavir therapy in treatment-experienced patients, with respect to baseline viral genotype in three studies and baseline viral phenotype in one study.
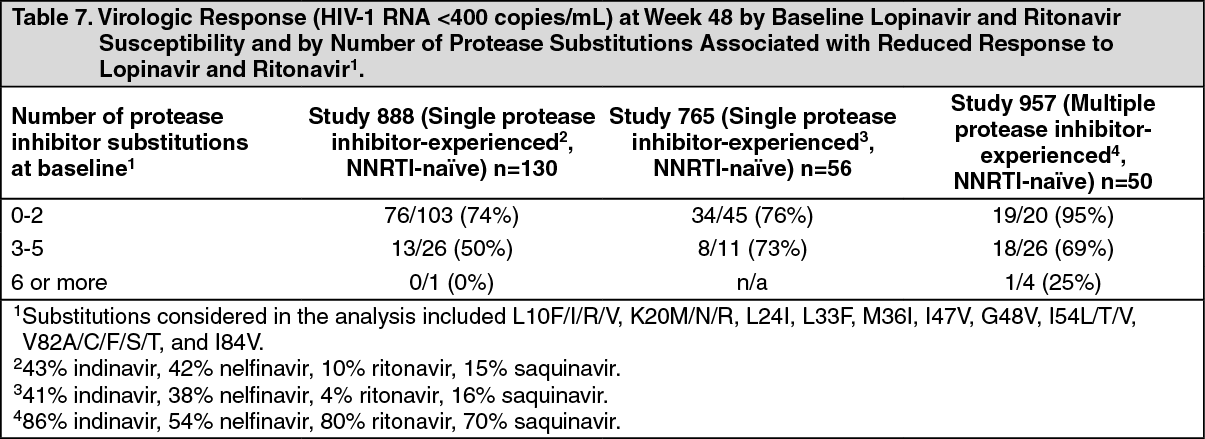
Virologic response to lopinavir and ritonavir has been shown to be affected by the presence of three or more of the following amino acid substitutions in protease at baseline: L10F/I/R/V, K20M/N/R, L24I, L33F, M36I, I47V, G48V, I54L/T/V, V82A/C/F/S/T, and I84V. Table 7 shows the 48-week virologic response (HIV-1 RNA <400 copies/mL) according to the number of the above protease inhibitor resistance mutations at baseline in studies 888 and 765 (see Pharmacology: Pharmacodynamics: Clinical Studies: Patients with Prior Antiretroviral Therapy and Other Studies Supporting Approval as previously mentioned and study 957 (see as follows). (See Table 7.)
 Click on icon to see table/diagram/image
Virologic response to lopinavir and ritonavir therapy with respect to phenotypic susceptibility to lopinavir at baseline was examined in Study 957. In this study 56 NNRTI-naïve patients with HIV-1 RNA >1,000 copies/mL despite previous therapy with at least two protease inhibitors selected from indinavir, nelfinavir, ritonavir, and saquinavir were randomized to receive one of two doses of lopinavir and ritonavir in combination with efavirenz and nucleoside reverse transcriptase inhibitors (NRTIs). The EC50 values of lopinavir against the 56 baseline viral isolates ranged from 0.5- to 96-fold the wild-type EC50 value. Fifty-five percent (31/56) of these baseline isolates displayed >4-fold reduced susceptibility to lopinavir. These 31 isolates had a median reduction in lopinavir susceptibility of 18-fold. Response to therapy by baseline lopinavir susceptibility is shown in Table 8. (See Table 8.)
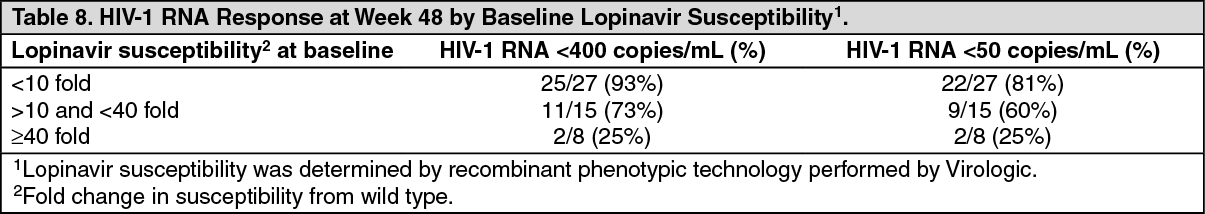 Click on icon to see table/diagram/image